
Every layer below is in the ICT menu of the ICC Charts web terminal: open it from the top bar, switch a layer on or off with one click, or press All. Apply to all charts copies the choice to every chart of your layout. The same layers are in the Android and Windows apps.
Please read: these indicators draw zones and levels by fixed rules, the same on every chart. They
are not signals and they do not predict price. Many setups at these zones lose, so test them on a demo account and always
use a stop. Trading with leverage carries a high risk of losing money.
The 14 layers
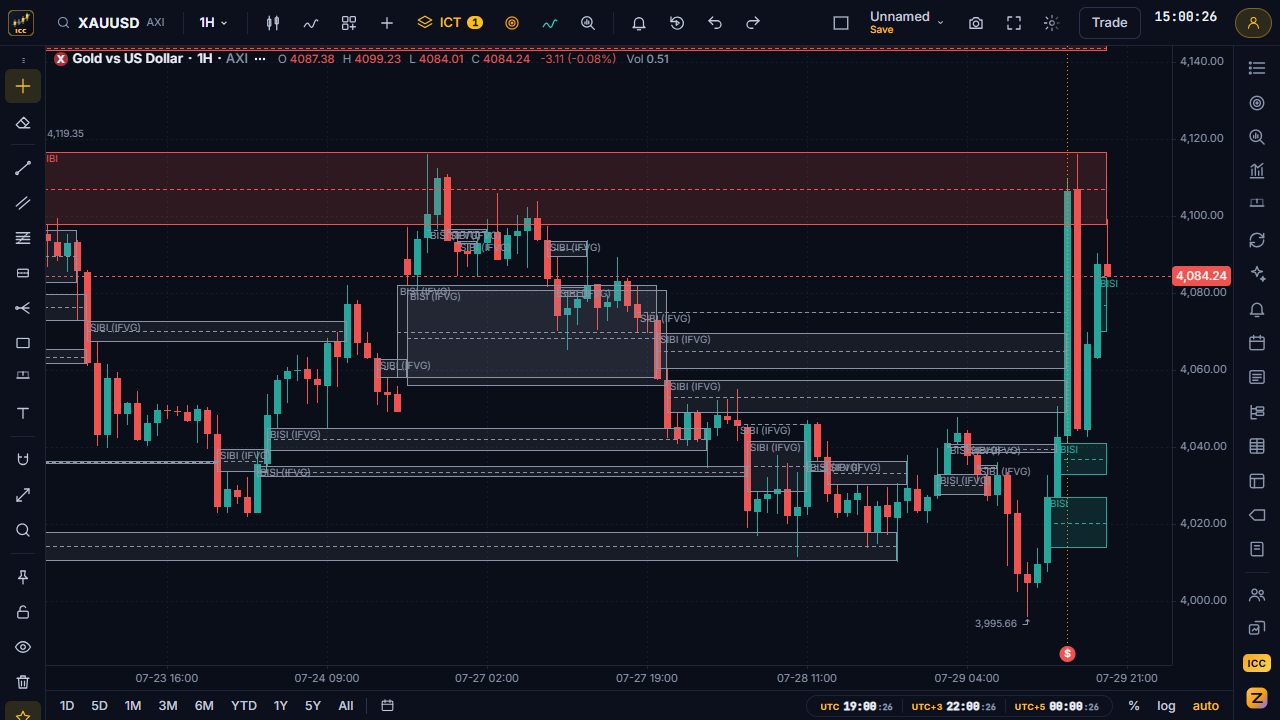
Fair value gaps (FVG / IFVG)
- What it draws
- Boxes over every fair value gap, bullish (BISI) and bearish (SIBI), with a dashed line at the middle (the CE). A gap that price closes through is relabelled as an inversion FVG (IFVG).
- The rule
- Three candles in a row. Bullish: the first candle's high is below the third candle's low; the space between them is the gap. Bearish: the first candle's low is above the third candle's high. The gap exists once the third candle closes. The box ends when price trades through its far edge; if a candle closes beyond it, the gap becomes an IFVG and acts from the other side.
- Settings
- Every gap counts, with no minimum size. Works on every timeframe.
Order blocks and breakers
- What it draws
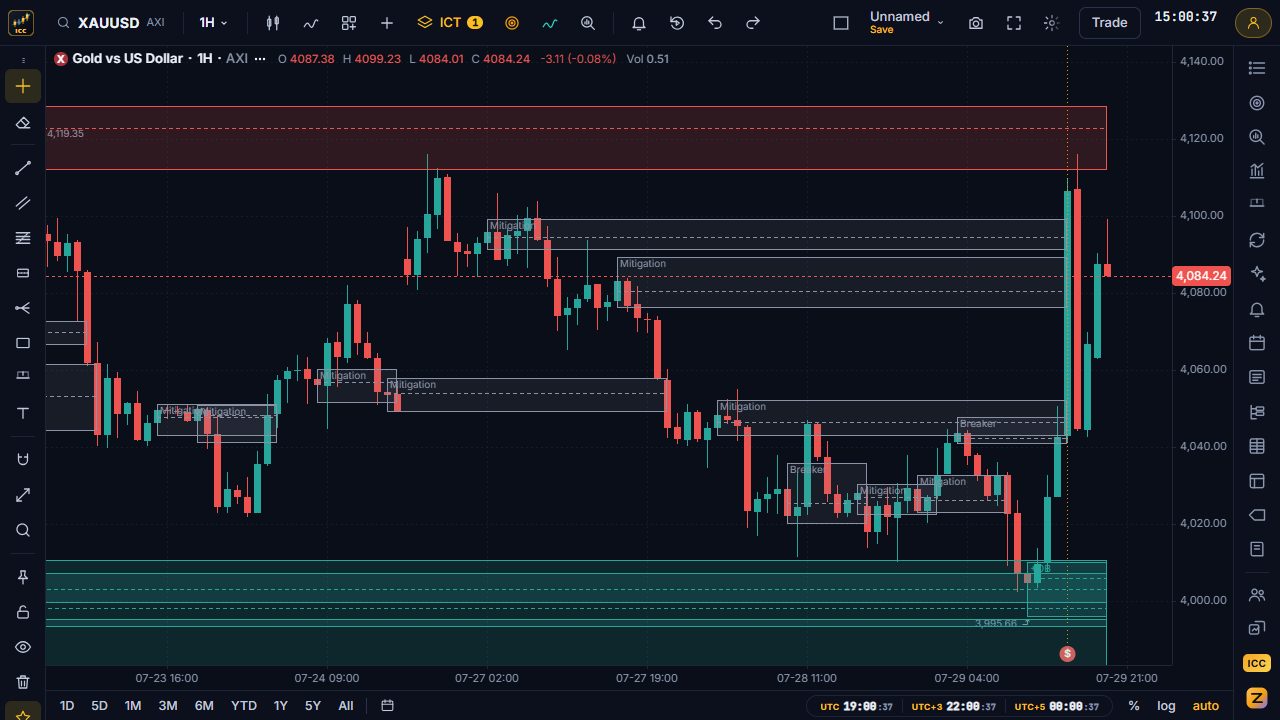
- Bullish and bearish order block boxes with their mean threshold, and the blocks that failed, labelled breaker or mitigation, which then act from the other side.
- The rule
- A bullish order block is the last down-close candle at (or just before) the low of a leg that then breaks structure upward; a bearish one mirrors it. It is known once the break closes. The mean threshold is 50% of the candle's body. A close beyond the far side means the block failed: it becomes a breaker if its leg had swept an earlier swing, otherwise a mitigation block.
- Settings
- One block per structure break, looking back up to 5 candles for the last opposite candle. Every timeframe.
Liquidity (BSL / SSL)
- What it draws
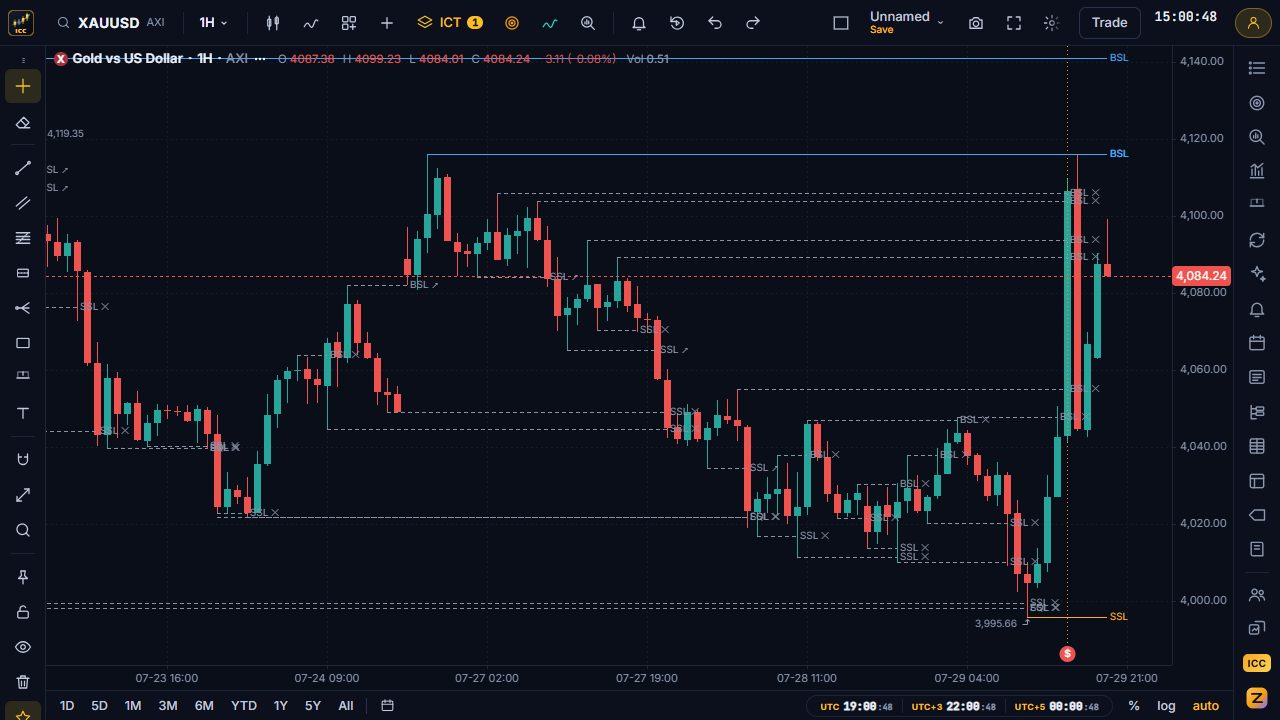
- Buy-side liquidity lines above swing highs and sell-side liquidity below swing lows, relative equal highs and lows, and a cross where a level was swept.
- The rule
- Stops rest above swing highs (BSL) and below swing lows (SSL). Two or more highs (or lows) almost at the same price, with no raid in between, form equal highs (or lows). When price trades beyond a level and closes back on the original side within 3 candles, it is a sweep (a stop raid); without that close back, the liquidity was simply taken (a run).
- Settings
- Equal means within 0.1 of the average true range. Every timeframe.
Market structure (BOS / MSS)
- What it draws
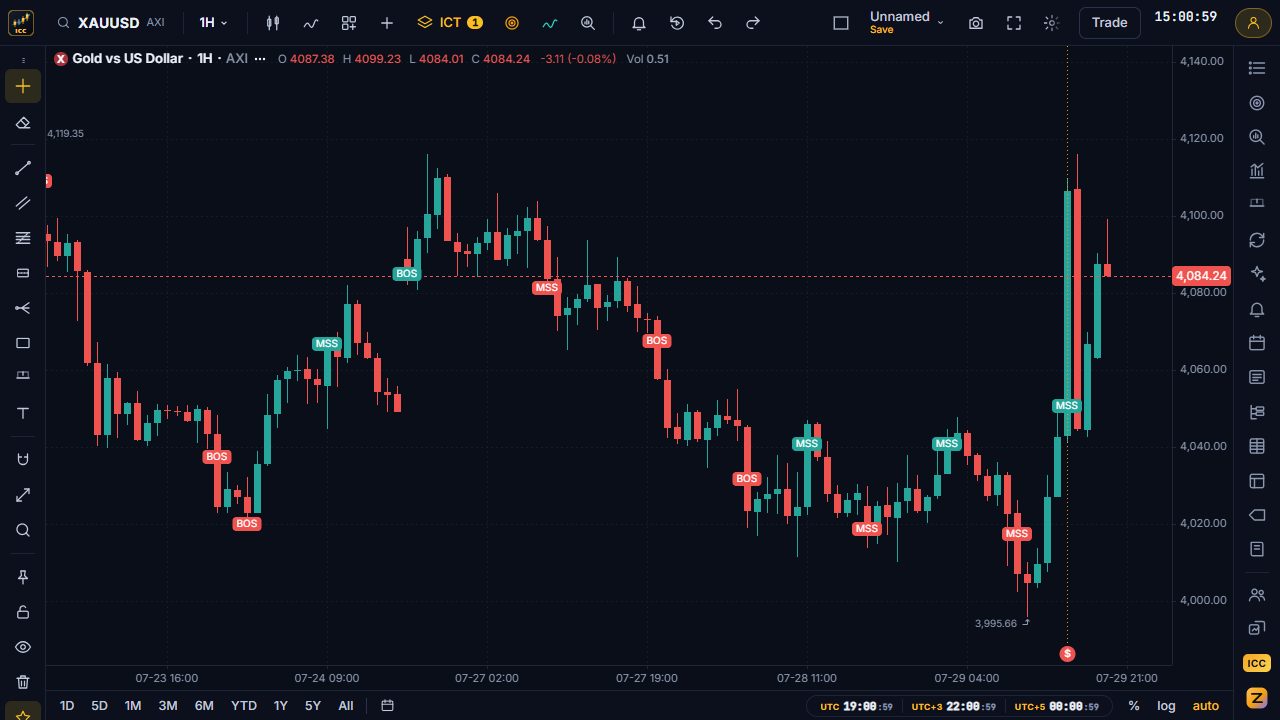
- A label at every break of structure (BOS, with the trend) and market structure shift (MSS, against it).
- The rule
- A swing high is a candle with lower highs on both sides (lows mirror it). A break needs a candle body close beyond the latest swing: above the last swing high is bullish, below the last swing low is bearish. A break against the current direction is an MSS, one in the same direction a BOS.
- Settings
- Swings use 1 candle on each side on 1-5 minute charts and 2 on higher timeframes. Every timeframe.
Sessions and killzones
- What it draws
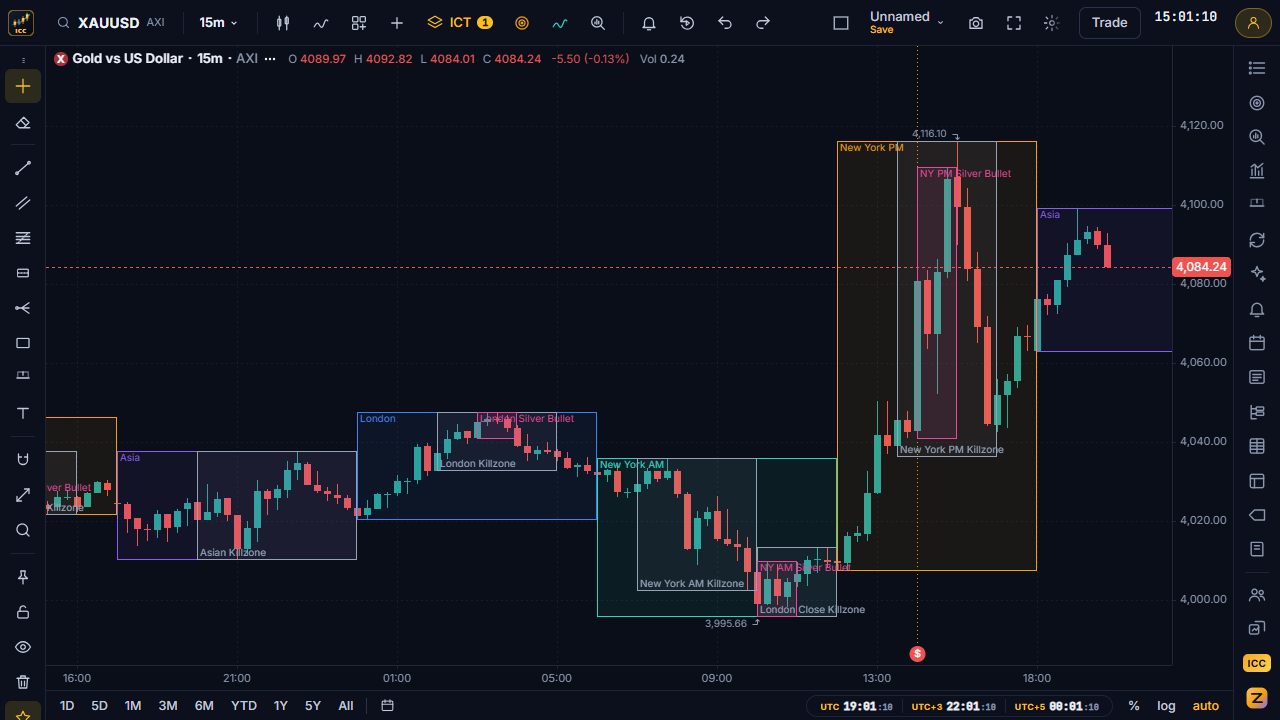
- Boxes for the Asia, London and New York sessions, the ICT killzones and the Silver Bullet hours, each with its high and low.
- The rule
- The windows are fixed in New York time, so they follow summer and winter time by themselves: Asian killzone 20:00-00:00, London 02:00-05:00, New York AM 07:00-10:00, London close 10:00-12:00, New York PM 13:30-16:00; Silver Bullet 03:00-04:00, 10:00-11:00 and 14:00-15:00.
- Settings
- Drawn on 1-minute to 1-hour charts, from 1-minute candles, so the times are exact.
Key levels and opens
- What it draws
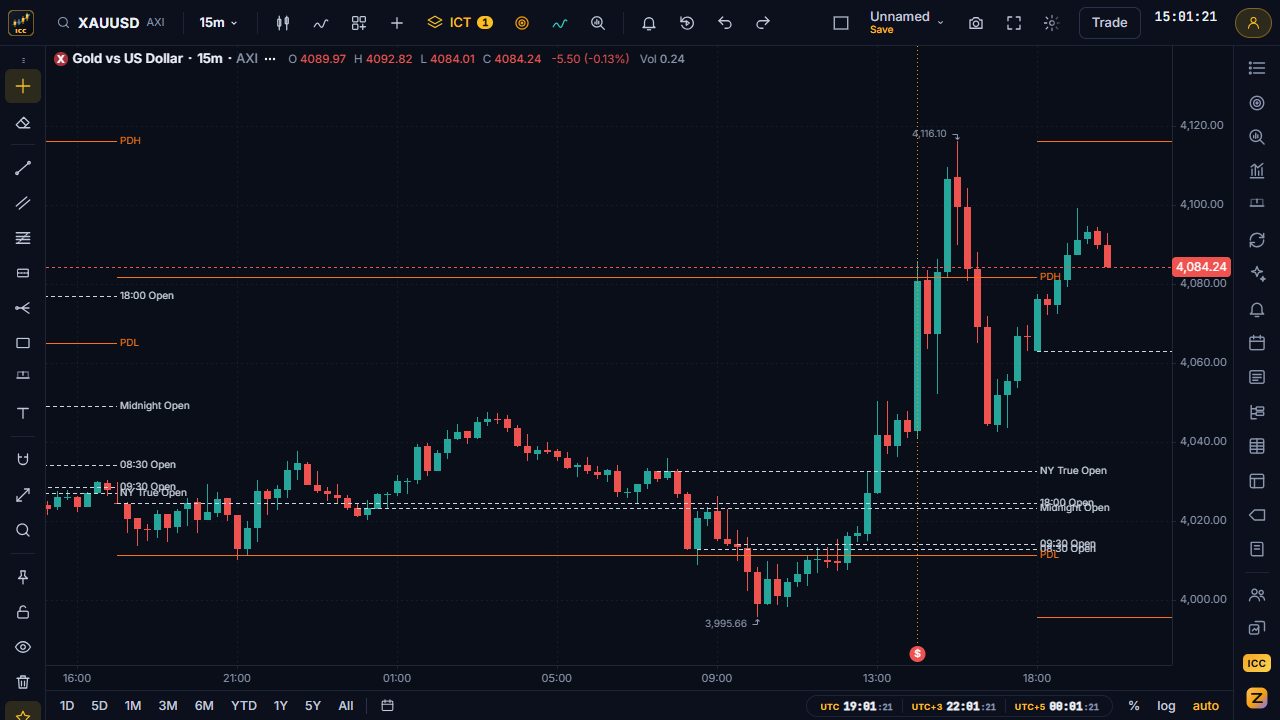
- Lines at the Midnight Open, the 18:00 open, the New York true open (07:30), the 08:30 and 09:30 opens, the previous day's high and low (PDH / PDL) and the previous week's high and low (PWH / PWL).
- The rule
- Each open is the price at that New York time; a level appears only once it is known (the Midnight Open at midnight, PDH / PDL at the start of the trading day).
- Settings
- Drawn on 1-minute to 4-hour charts.
Quarterly theory
- What it draws
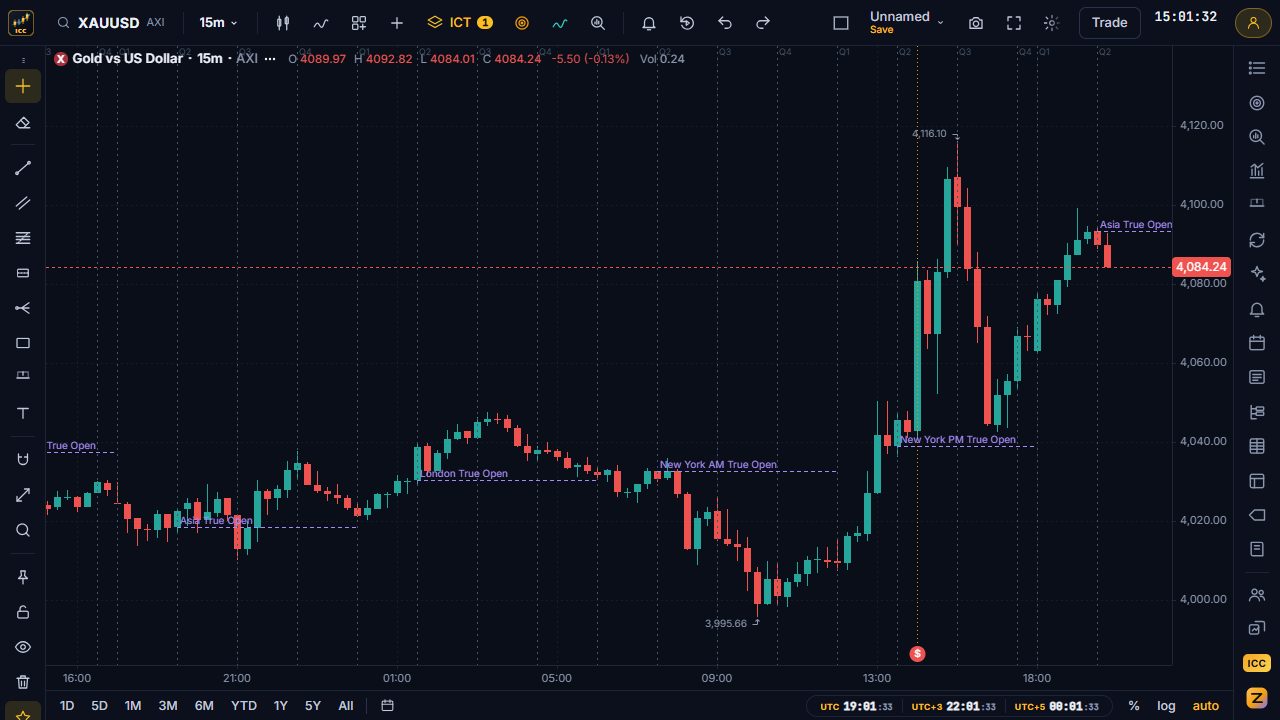
- Thin vertical lines that split every 6-hour session into four 90-minute quarters, and the true open of each session.
- The rule
- The trading day starts at 18:00 New York time and has four sessions (Asia, London, New York AM, New York PM). Each is cut into 90-minute quarters; the open of the second quarter is the session's true open.
- Settings
- Drawn on 1-minute to 30-minute charts.
Premium / discount and OTE
- What it draws
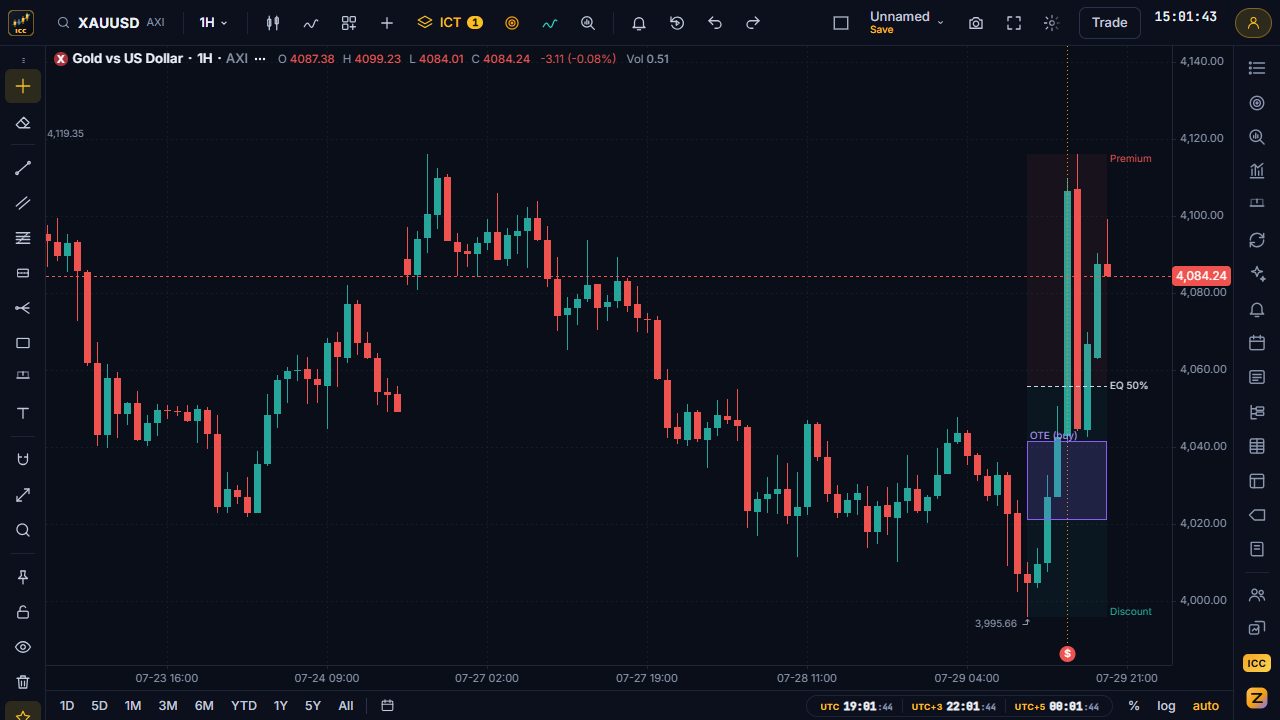
- The current dealing range with its 50% line (equilibrium), the premium half above and the discount half below, and the optimal trade entry band.
- The rule
- The range runs between the latest swing high and swing low. After a leg up, the OTE is the 62-79% pull-back into discount, with 70.5% as the sweet spot; after a leg down it mirrors into premium.
- Settings
- Every timeframe; it follows the newest swings.
Range projections (Asian range and CBDR)
- What it draws
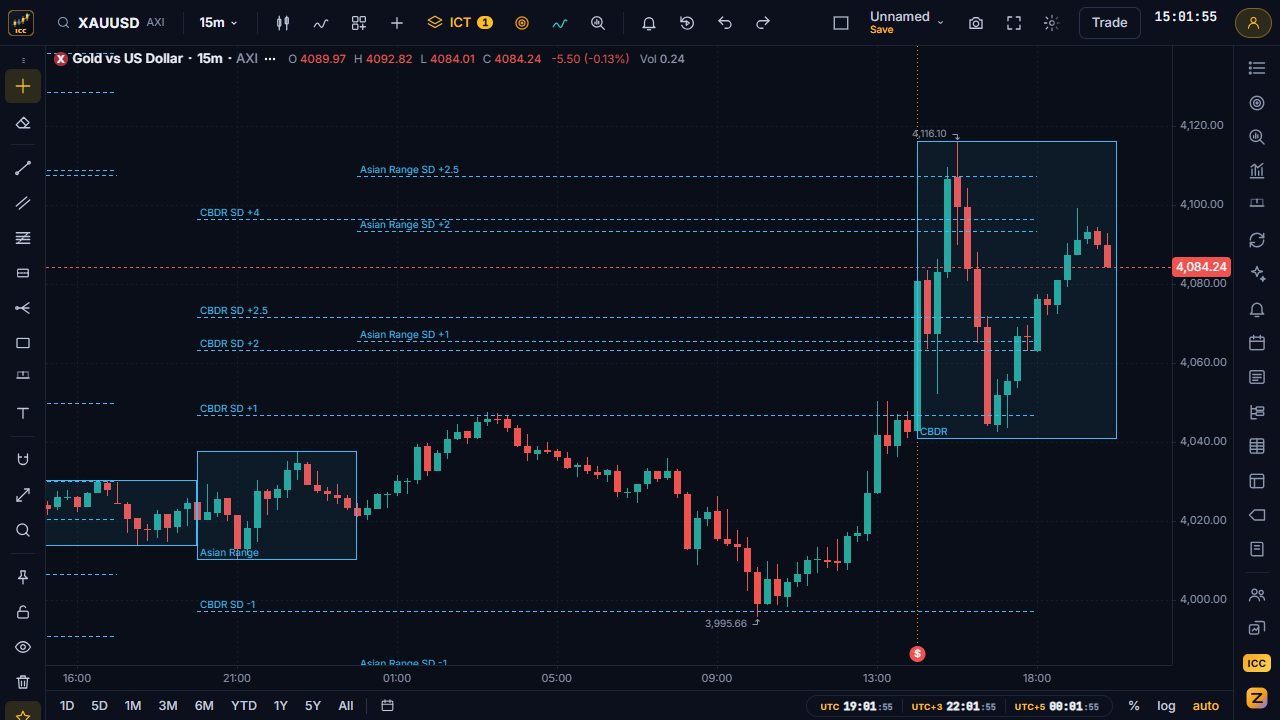
- The Asian range and the central bank dealers range (CBDR) boxes and their standard-deviation lines above and below.
- The rule
- The Asian range is 20:00-00:00 and the CBDR 14:00-20:00 New York time. Their height is projected 1, 2, 2.5 and 4 times above the high and below the low.
- Settings
- Drawn on 1-minute to 1-hour charts.
Opening gaps (NWOG / NDOG / ORG)
- What it draws
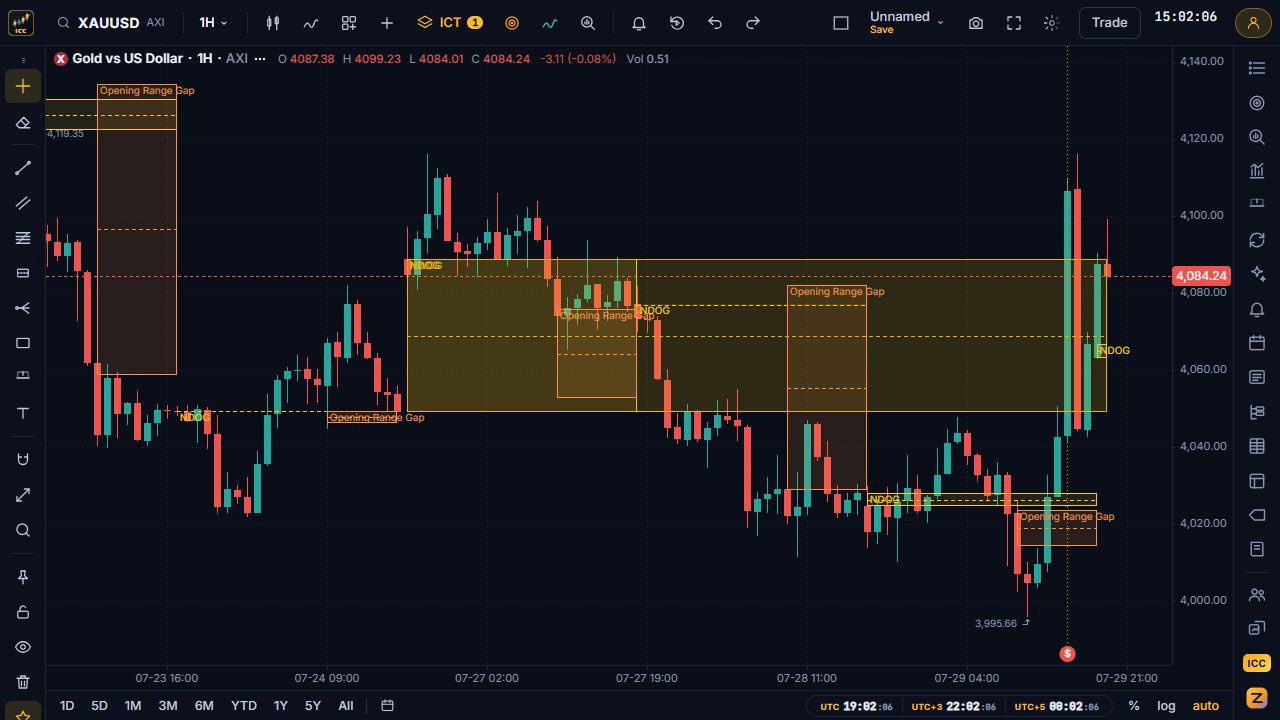
- Boxes for the new week opening gap, the new day opening gap and the opening range gap, each with its middle line.
- The rule
- NWOG: from Friday's close to the Sunday open. NDOG: from the previous day's close to the 18:00 open. Opening range gap: from the 16:15 close to the next 09:30 open. The middle of each gap is its consequent encroachment (CE).
- Settings
- Drawn on 1-minute to 4-hour and daily charts.
IPDA ranges
- What it draws
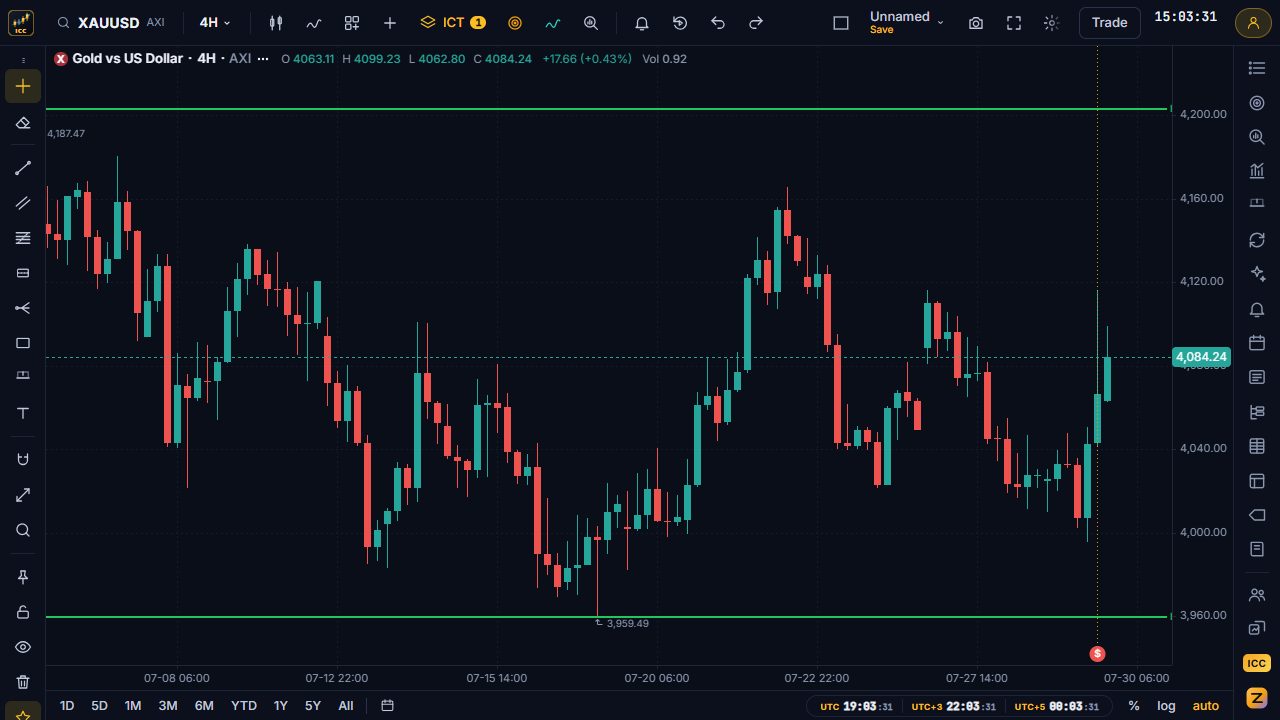
- Lines at the highest high and lowest low of the last 20, 40 and 60 trading days.
- The rule
- Each line is known at the open of the day: it uses only the days before it. ICT traders watch these levels as the large pools of liquidity price may reach for.
- Settings
- Drawn on 1-minute to 4-hour and daily charts. A range needs that many past days of data (this picture has 20).
SMT divergence
- What it draws
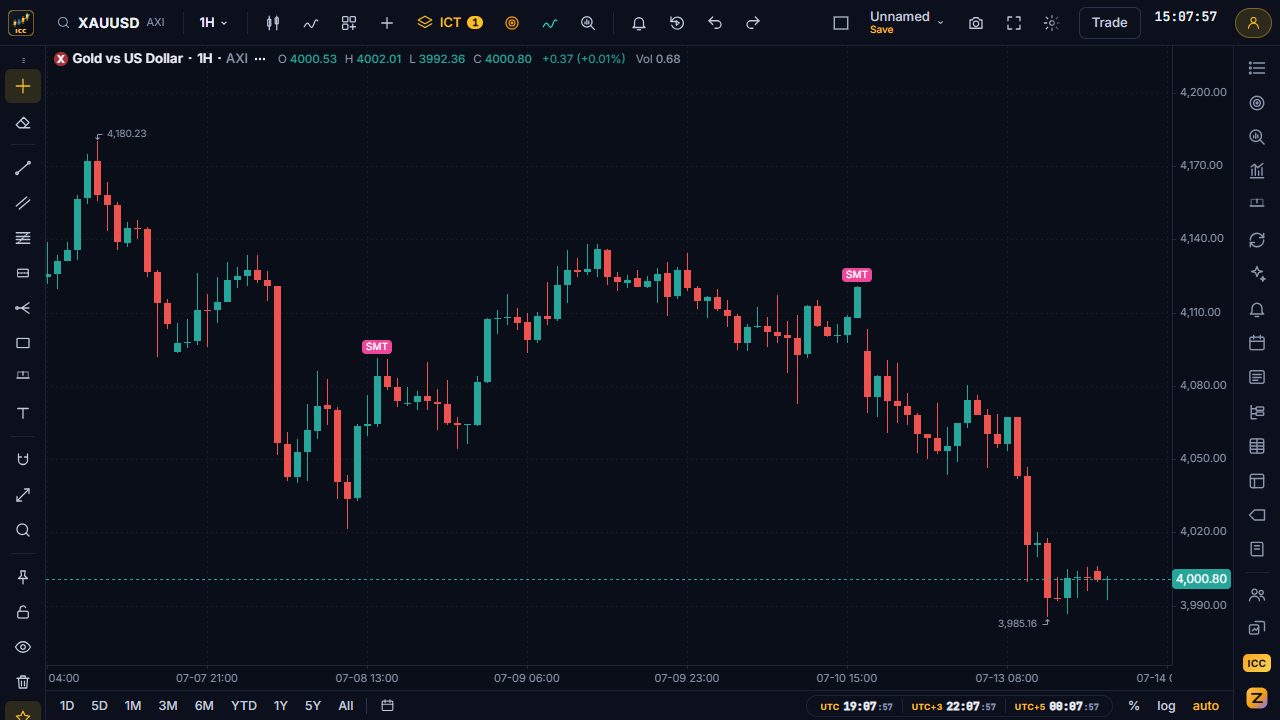
- A mark where the chart and its correlated market disagree at a swing.
- The rule
- Gold is compared with silver, NAS100 with US500 and EURUSD with GBPUSD. When one makes a higher high (or lower low) and the other does not, that is an SMT divergence. The mark appears only once the swing is confirmed, so it never looks ahead.
- Settings
- Drawn on the symbols above, on bars both markets have.
Daily bias
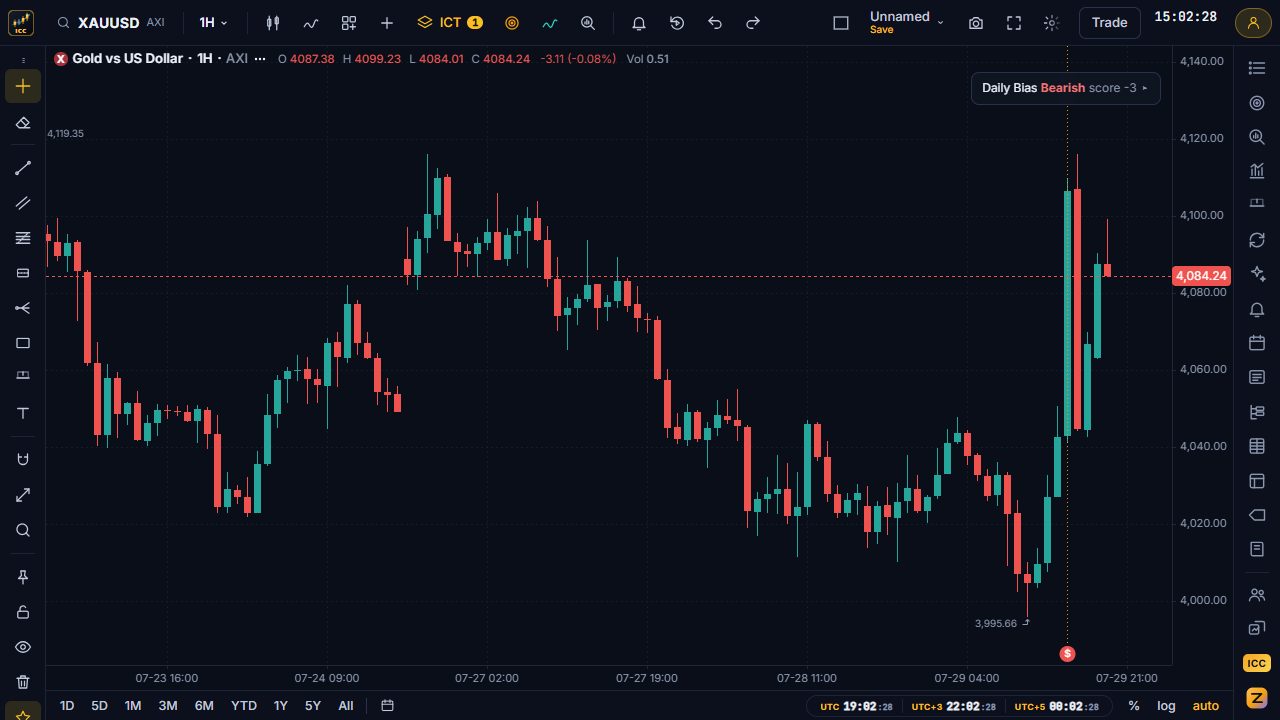
- What it draws
- A small panel in the chart corner: today's bias (bullish, bearish or none), its score and the draw on liquidity.
- The rule
- Five votes of +1, 0 or -1: the daily structure, the 4-hour structure, where price sits in the 20-day IPDA range, a raid and reclaim of yesterday's high or low, and price against the Midnight Open. A bias is set when the score reaches 2 or more either way. The draw on liquidity is the nearest resting pool in that direction.
- Settings
- Any timeframe; the bias itself is worked out on daily and 4-hour data.
Displacement and volume imbalance
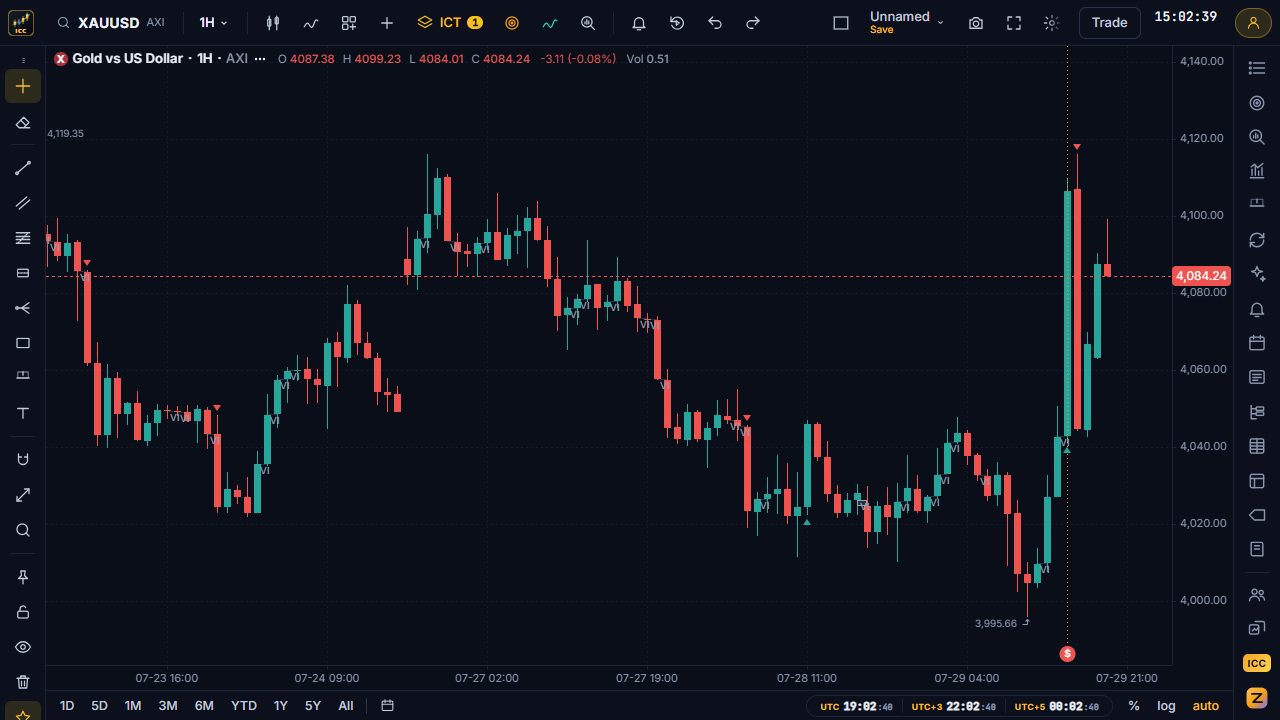
- What it draws
- A small marker under or over every displacement candle, and thin boxes at volume imbalances.
- The rule
- Displacement: a candle whose body is at least 1.5 times the average true range and at least 60% of its own range. Volume imbalance: two candles whose bodies do not overlap while their wicks do.
- Settings
- Every timeframe.
Try them on a live chart
Open the chart, pick a market and switch the layers on in the ICT menu. Want to train your eye first? The Chart Challenge game shows real past charts and asks you to find the gap, the block or the sweep.