
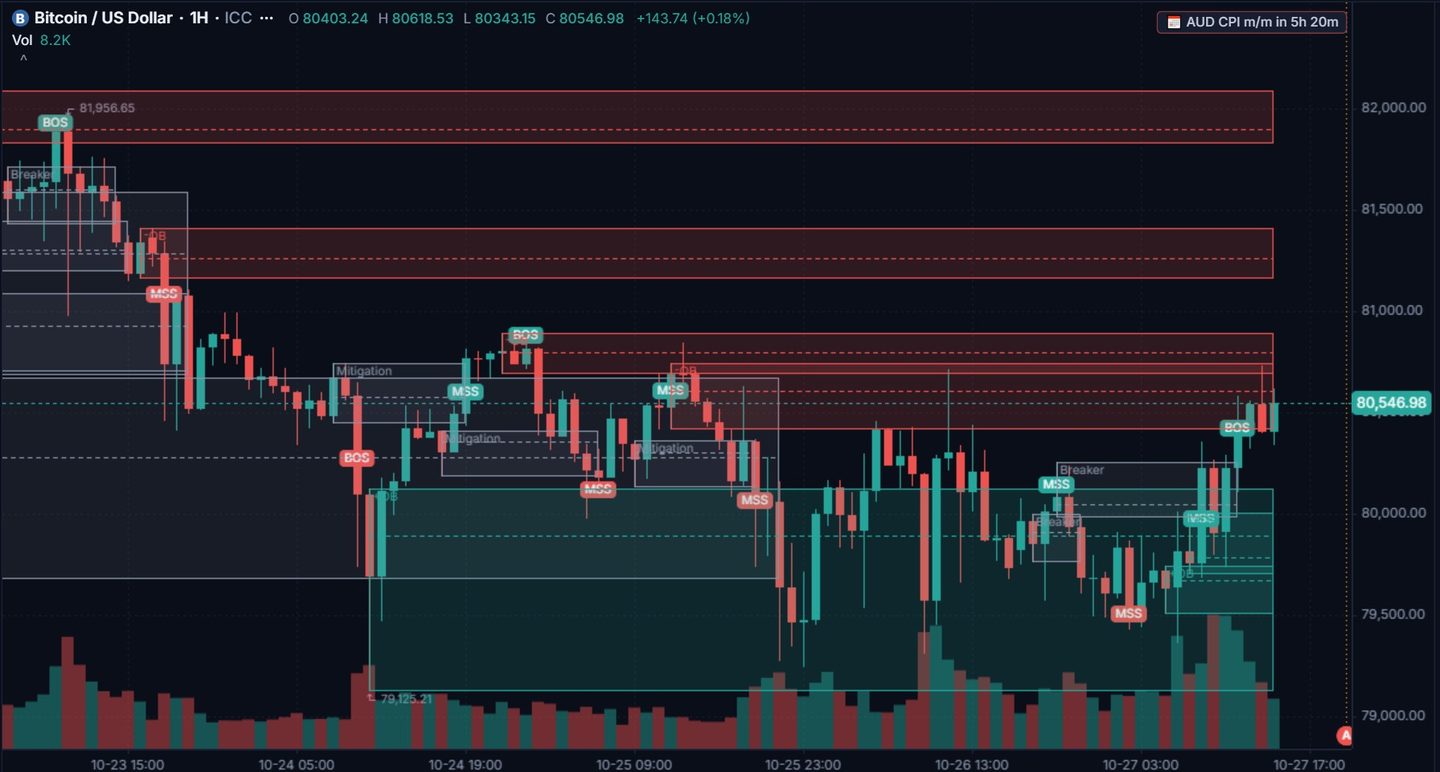
What the chart shows
Follow the picture from left to right. On 23 October Bitcoin rolled over from about 81,950: the red MSS label marks the first break against the up-move, and the last up-close candles before those drops are drawn as red bearish order blocks. They stay on the chart as areas above price.
On 24 October the drop ran to about 79,125 and turned. The last down-close candle before the move that shifted the structure back up (the teal MSS label later that day) became the large teal bullish order block, roughly 79,100 to 80,100. Over the next two days price fell back into that box twice and both times was bought before reaching its lower edge. The dashed line through the box is its middle (the mean threshold): many traders treat a close below it as the block failing.
The rule in short
- A bullish order block is the last down-close candle (or group of candles) before a move up that breaks structure.
- It carries weight when the move away is strong (displacement), leaves a fair value gap or breaks a clear high.
- The first return to the block is the one traders watch; a block that is traded through and closed below loses its meaning, and the chart then marks it as a breaker.
What is different on crypto
Bitcoin trades all week, so there is no weekend gap on the CFD feed, but the weekend is usually thinner and moves made then are less reliable. Bitcoin also moves in larger percentages than gold or forex: a block 1 % deep is normal, so a stop under the block has to be sized for that with the crypto position size calculator. The rule itself does not change.
Try it on the chart
Open BTCUSD in ICC Charts, pick the 1h chart and switch on the same layer in the ICT menu. New accounts get the first 14 days free.
Trading a prop firm challenge?
Some prop firms also offer crypto CFDs with daily loss and drawdown limits; size every trade from its stop loss with the crypto position size calculator.
FundedNext Partner link offers funded trading challenges. We may earn a commission if you buy through it. Prop firm challenges are paid evaluations; most traders don't pass. Trade only what you can afford to lose.
Questions
Do ICT order blocks work on Bitcoin?
The idea is the same on any liquid chart: the last opposite candle before a strong break is an area traders watch when price returns. Whether a given block holds is never certain.
Which timeframe is best for order blocks on crypto?
Many traders mark blocks on the 1-hour or 4-hour chart and look for the entry on the 5- or 15-minute chart. Higher timeframes give fewer but stronger areas.
Charts: crypto CFD candles of a broker's MT5 demo feed, shown in the ICC Charts web terminal. ICC Charts is not affiliated with Inner Circle Trader; the lessons explain the concepts in our own words. Crypto trading with leverage carries a high risk of losing money; this is education, not financial advice and not a signal.