
The Asian Q2 Judas is the Judas swing moved to the evening. The Asian session is split into four 90-minute quarters. In the second one, shortly after the Asian session opens, price often takes the high or low of the first quarter and turns. Our M5 scanner looks for that move on the 5-minute chart. This lesson explains the idea, gives M5's exact rules, a real filled win and a real filled loss from a year of gold, the whole year's numbers, the usual mistakes and a quiz.
The idea
- Q1 sets the range. The first quarter of the Asian session (18:00-19:30 New York time) makes a high and a low.
- Q2 takes one side. In Q2 (19:30-21:00 New York time), price pushes through that high or low and gathers the stops there. See liquidity.
- The turn. Price shifts structure and runs the other way. The trader enters on the turn. For the daytime version of the same idea see the Judas swing and turtle soup.
The M5 rules, as our engine reads them
| Window | New York | UTC (winter) | PKT (winter) | IST (winter) |
|---|---|---|---|---|
| Asia Q1 (the range) | 18:00-19:30 | 23:00-00:30 | 04:00-05:30 | 04:30-06:00 |
| Asia Q2 Judas window | 19:45-21:00 | 00:45-02:00 | 05:45-07:00 | 06:15-07:30 |
In summer the UTC, PKT and IST times are one hour earlier. More in killzones and sessions.
- Bias first. The daily bias is set before the window. No bias, no trade.
- The levels. Only two sets count: the previous day's high and low, and the high and low of Asia Q1.
- The raid. From 15 minutes before the window until its end, price trades through one of those levels on the side against the bias: below a low for a buy, above a high for a sell.
- A shift on the 5-minute chart, then a fair value gap created within 4 five-minute candles of the shift. See market structure.
- Entry and stop. A limit order at the middle (CE) of the gap. The stop goes beyond the raid's extreme by twice the symbol's normal stop buffer.
- Targets. The next liquidity levels in the trade direction, nearest first and at least 1R away; the last one at least 2R away, otherwise the setup is skipped.
- Time limits. The order expires when the window ends; a trade still open is closed 3 hours after the window ends.
A real win: gold, 6 May 2026
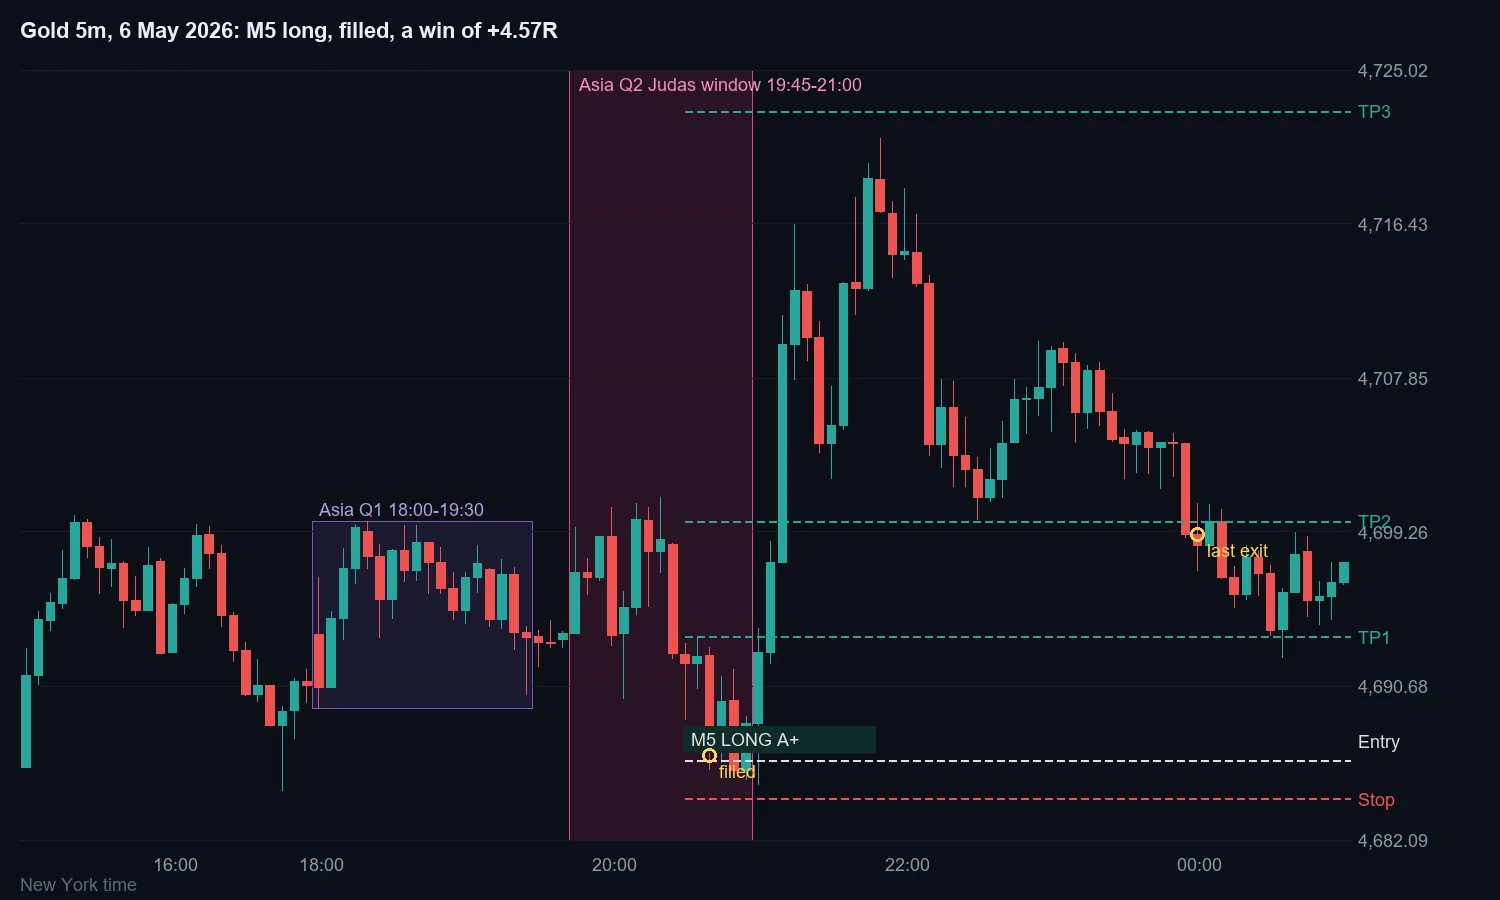
Gold fell below the low of Asia Q1 early in Q2, turned up, and the model bought the gap at 4,686.51 with the stop at 4,684.39. TP1 (4,693.41) closed half the trade, TP2 (4,699.85) closed 30% a few minutes later, and the last 20% was closed by the time limit at 4,699.15. Result: +4.57R. Note how close the stop was: about two dollars. A small stop turns a modest move into a large number of R, and the same applies to losses.
A real loss: gold, 5 May 2026
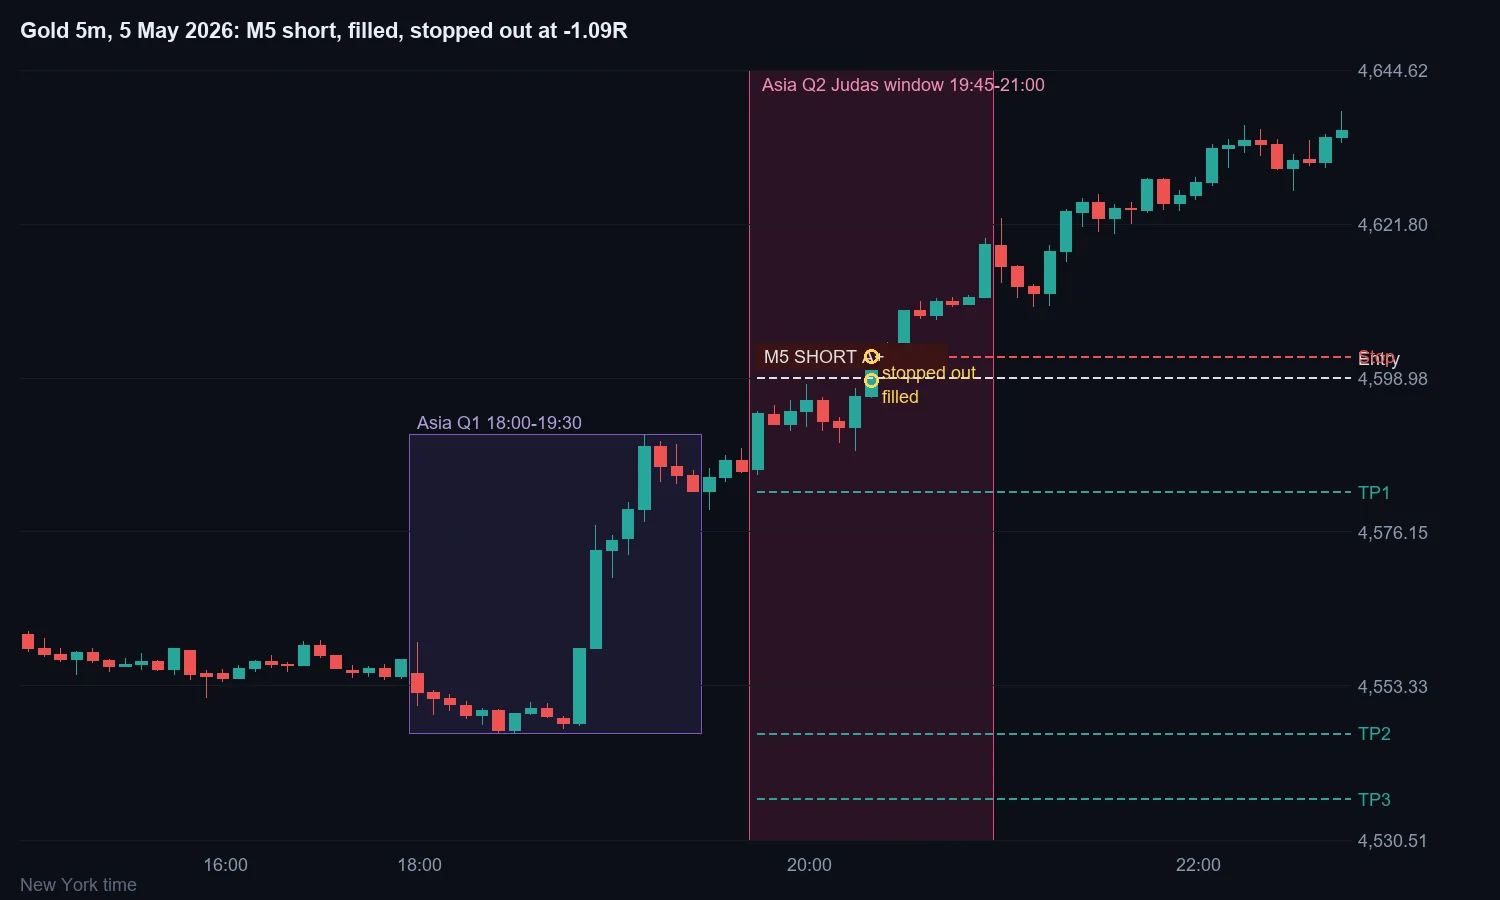
Gold had climbed through Asia Q1 and pushed above its high in Q2. The model treated that as a raid and sold at 4,598.98 with the stop at 4,602.17. It was not a raid: gold kept rising for the rest of the evening and the stop was hit within minutes. A push through a level that keeps going is a breakout, not a Judas swing, and from the first shift alone you cannot always tell which one you are in. Result: -1.09R.
The worst trade of the year was the 27 July short: -2.25R on a stop only 24 cents from the entry, where the spread and the fill turned a normal stop into more than twice the planned risk. Very tight stops are a risk of their own.
The whole year on gold
Both trades come from one run of our strategy tester's simulator on gold 1-minute history, 1 October 2025 to 30 September 2026 (fills on the next candle, the stop checked first, the spread paid):
| M5 on gold, 1 Oct 2025 - 30 Sep 2026 | Setups | Filled trades | Win rate | Total | Profit factor |
|---|---|---|---|---|---|
| With the daily bias filter | 7 | 3 | 1 of 3 | +1.22R | 1.37 |
| Without the bias filter | 211 | 73 | 29% | -5.92R | 0.89 |
With the bias filter, M5 traded three times in a year, which is far too few to say anything. Without it, 73 trades lost 5.92R, with a worst losing run of 25.4R. The result changed with the period: October to December 2025 made +7.1R in 16 trades with half of them winning, while 2026 lost 13.0R in 57 trades with 23% winning. So this model has not shown a stable edge on gold. It is a pattern to understand and to test on your own market and months, not one to trade blindly.
Test it yourself
Run M5 on your own market and months in the strategy tester in the web terminal (the free trial includes it). It uses the same rules and shows every trade, win or loss. If you try it live, start on a demo account.
Common mistakes
- Selling every push above the Q1 high. As the loss shows, a push that keeps going is a breakout.
- Using the wrong quarter. Q1 is 18:00-19:30 New York time; the window is 19:45-21:00, not the whole of Q2.
- Trading with very tight stops. Spread and fills can turn a one-R stop into a bigger loss.
- Forgetting the clock change. In summer every UTC, PKT and IST time is one hour earlier.
- Trusting one good quarter. The model made money in late 2025 and lost in 2026; the year as a whole is the picture.
Check yourself: 3 questions
1. Which two sets of levels does M5 raid?
The previous day's high and low, and the high and low of Asia Q1 (18:00-19:30 New York time).
2. The bias is bullish. In the window price pushes above the Asia Q1 high. Is that the raid M5 wants?
No. For a bullish bias M5 wants a raid of a low, against the bias. A push above the high is in the direction of the bias.
3. On 5 May 2026 the model sold above the Q1 high and gold kept rising. What went wrong?
The push through the Q1 high was a real breakout, not a raid, and the setup could not tell them apart at the time of entry. The stop was hit and the loss was -1.09R.
Practise it
Train your eye for the raid with the liquidity sweep practice in the Chart Challenge. For another model built on the same Asian ranges, read the Asian range, CBDR and the London sweep.
Education only, not financial advice. Trading involves a high risk of loss; past results, including the tester numbers above, do not predict future results. Practise on a demo account first.
Open ICC Charts in your browser, free, with the ICT and VSA layers and the model scanner. Or practise on past charts in the free Chart Challenge game.
Open it on the chart → Play the chart gameNew articles and the daily chart challenge on Telegram → t.me/icccharts
More articles
- سلور بُلٹ کیا ہے؟ پاکستان کے وقت میں اردو گائیڈ
- پریمیم اور ڈسکاؤنٹ کیا ہے؟ ڈیلنگ رینج اردو میں
- رسک مینجمنٹ: ہر ٹریڈ میں کتنا رسک کریں؟ (اردو)
- مارکیٹ اسٹرکچر: BOS اور MSS کیا ہیں؟ (اردو)
- پرائس ایکشن کیا ہے؟ پرائس ایکشن اور SMC میں فرق (اردو)
- لیکویڈیٹی اور اسٹاپ ہنٹ کیا ہے؟ آسان اردو گائیڈ
- آرڈر بلاک کیا ہے؟ اردو میں (بریکر بلاک کے ساتھ)
- گولڈ میں لاٹ سائز اور ٹریڈنگ کا بہترین وقت (پاکستان ٹائم)
- فاریکس ٹریڈنگ کیا ہے؟ اردو میں بنیادی گائیڈ
- فیئر ویلیو گیپ (FVG) کیا ہے؟ آسان اردو گائیڈ
- اسمارٹ منی کانسیپٹ (SMC) اردو میں: آسان رہنمائی
- ICT کِل زونز پاکستان کے وقت میں (PKT)
- Price action क्या होता है? Price action vs SMC हिंदी में
- FVG (Fair Value Gap) क्या है? हिंदी गाइड
- ICT Killzones भारतीय समय (IST) में
- Order Block क्या है? हिंदी में (Breaker Block के साथ)
- CISD in ICT: change in state of delivery explained
- Breaker block entry rules: a step-by-step guide
- ICT Asian range and CBDR: marking them before London
- Market Maker Buy and Sell Model (MMXM) in plain words
- ICT PD arrays: how to rank zones in premium and discount
- How to backtest ICT concepts: journal 50 setups first
- Volume imbalance vs fair value gap: how to tell them apart
- Previous day and week highs and lows as liquidity targets
- Balanced Price Range (BPR): when two opposite gaps overlap
- Mitigation block vs order block: what is the difference?
- Equal highs and equal lows (EQH / EQL): obvious liquidity pools
- Inversion Fair Value Gap (IFVG): when a gap flips its role
- Displacement in ICT: what a strong move tells you
- London Close Reversal and London Protraction explained
- BOS vs CHoCH: break of structure vs change of character
- Inducement in trading: what it is and how to spot it
- Supply and demand zones vs order blocks
- Price action vs smart money concepts (SMC)
- Free MT5 FVG and order block indicator (same rules as ICC Charts)
- Chart Challenge: a free game to practise ICT concepts on real charts
- ICT daily bias: how to read the day's direction before the open
- Draw on liquidity: how to find where price is likely heading
- SMT divergence: how correlated markets can warn you before a reversal
- NWOG and NDOG: how ICT traders use opening gaps
- Power of 3 (AMD): accumulation, manipulation and distribution, with a real M8 setup
- Optimal Trade Entry (OTE, M4): the rules, a real win, a real loss and a year of results
- Premium, discount and the OTE: where to buy and sell in a range, with real chart examples
- ICT 2022 Mentorship model (M2): the rules, a real win, a real loss and a year of results
- Asian range scalp (M6): the rules, a real win, a real loss and a year of results
- The ICT Unicorn model: when a breaker block meets a fair value gap
- Order blocks, breakers and mitigation blocks, with real chart examples
- ICT Silver Bullet: the M1 rules, a real win, a real loss and a year of results
- The Judas swing and turtle soup (M3): rules, a real win, a real loss and a year of results
- Wyckoff and VSA: reading accumulation and distribution with volume
- Fair Value Gap (FVG): meaning, real chart examples and how to trade it
- Liquidity in trading: buy-side, sell-side, sweeps and runs, with real chart examples
- Market structure: break of structure (BOS) vs market structure shift (MSS), with real chart examples
- Volume Spread Analysis (VSA) basics: effort, result and no supply
- ICT killzones and sessions: the times in New York, UTC, Pakistan and India, with real chart examples
- How to use the ICC Charts model scanner and alerts